
We hear a lot about flattening the curve of coronavirus infections locally and nationally. In this story, UCSC Science Communication intern Ashleigh Papp explores the thinking, and the science, behind models and what they can tell us about the future, if anything. Read the transcript:
Hello, I’m Ashleigh Papp, a KSQD intern and science reporter. And today, I want to know — why is everyone talking about bending the curve of coronavirus cases?
~various voices mentioning “the curve”
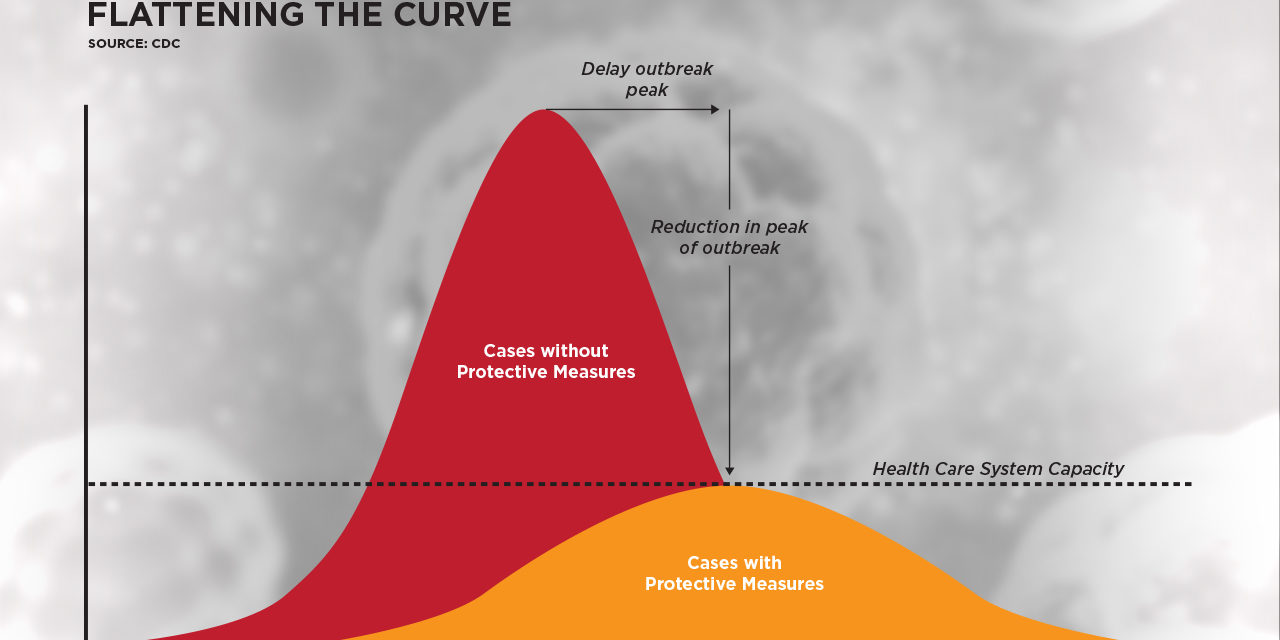
You’ve probably heard a lot about “the curve”. The curve people are referring to is a graphical representation of how the corona virus spreads. It’s used by epidemiologists and public health officials to show an infection rate over time.
On the graph itself, the y-axis, or vertical line, represents the number of confirmed COVID-19 cases, while the x-axis, or horizontal line represents time.
As more COVID-19 test results become available, more data points are plotted. For Santa Cruz county’s curve, officials are aggregating results from the tests being done by the public health labs and commercial labs. And right now, COVID-19 tests aren’t widely available, so this number only represents a fraction of people who are probably infected.
It’s worth mentioning that beyond where we currently are in time, everything on the graph is purely speculative. It’s based off how things have been going up until now.
So the line, or curve, of the graph changes depending on how fast people are getting infected and testing positive. A steeper curve up means that more people are getting infected in a small amount of time.
This scenario is a problem because with too steep of a curve, the health system will get bombarded all at once. This means a shortage on ICU beds, ventilators, and medical staff.
On the more manageable side, a gently sloping upward curve means that people are getting infected over a much longer period of time. This “flattening” or “bending” of the curve would allow medical staff to respond without having to make ultimatum choices about who gets care and who doesn’t.
The number of data points, or people getting infected with COVID-19, doesn’t change whether there’s a steep or elongated curve. The question being answered by this graph isn’t if it will spread, but how fast it will happen.
And as of Monday, April 20, Santa Cruz county’s curve is looking better than experts anticipated. Instead of one giant Everest-shaped peak in the curve, it looks like we may have multiple smaller, rolling hills of infection over time. Gail Newel, Santa Cruz County’s Health Officer, sounds hopeful:
“We are among the very best counties in the state of California in terms of flattening the curve. So instead of a doubling time every six days, as we had anticipated would happen in a community like ours, we are now having a doubling time of eight days.”
That doubling time she mentions refers to how many days it takes for the number of confirmed infections, hospitalizations or deaths to double. According to Newel, that two day difference doesn’t sound like very much, but it could actually offer our healthcare system the break it needs to survive.
Mimi Hall, Santa Cruz County’s Health Services Agency Director, agrees:
“Our hospitals are not seeing the surge as early as we had thought three weeks ago due to the increased doubling time. So we’ve delayed that request for a couple of weeks. And if our community does really really well with social distancing, we hope we can delay that even more, perhaps indefinitely.”
So far, it seems like our dedication to sheltering in place is having a similar effect across the state. California governor Gavin Newson is urging people to stay the course:
“We’ve got to continue to practice physical distancing, social distancing, and safe practices that have helped us bend this curve and mitigate what some had thought would be a surge that was exponentially worse than so far it has been.”
Right now, Santa Cruz County public health officials are estimating our county’s curve to peak in late May or early June. And beyond that, they’re not really sure how things will look on the other side.
Although China has recently seen a significant drop in their cases, some experts are worried that a second peak may be imminent. While doctors are still working to develop a vaccine, social distancing, quarantine and contact tracing are really the only tools health officials can use to draw out, or flatten, the curve. And these will require public cooperation over the long haul.
This is Ashleigh Papp, a science reporter with KSQD — don’t forget to keep yourself healthy and stay positive!


